Introduction
Code on Github: Install DMARC Report Visualizer
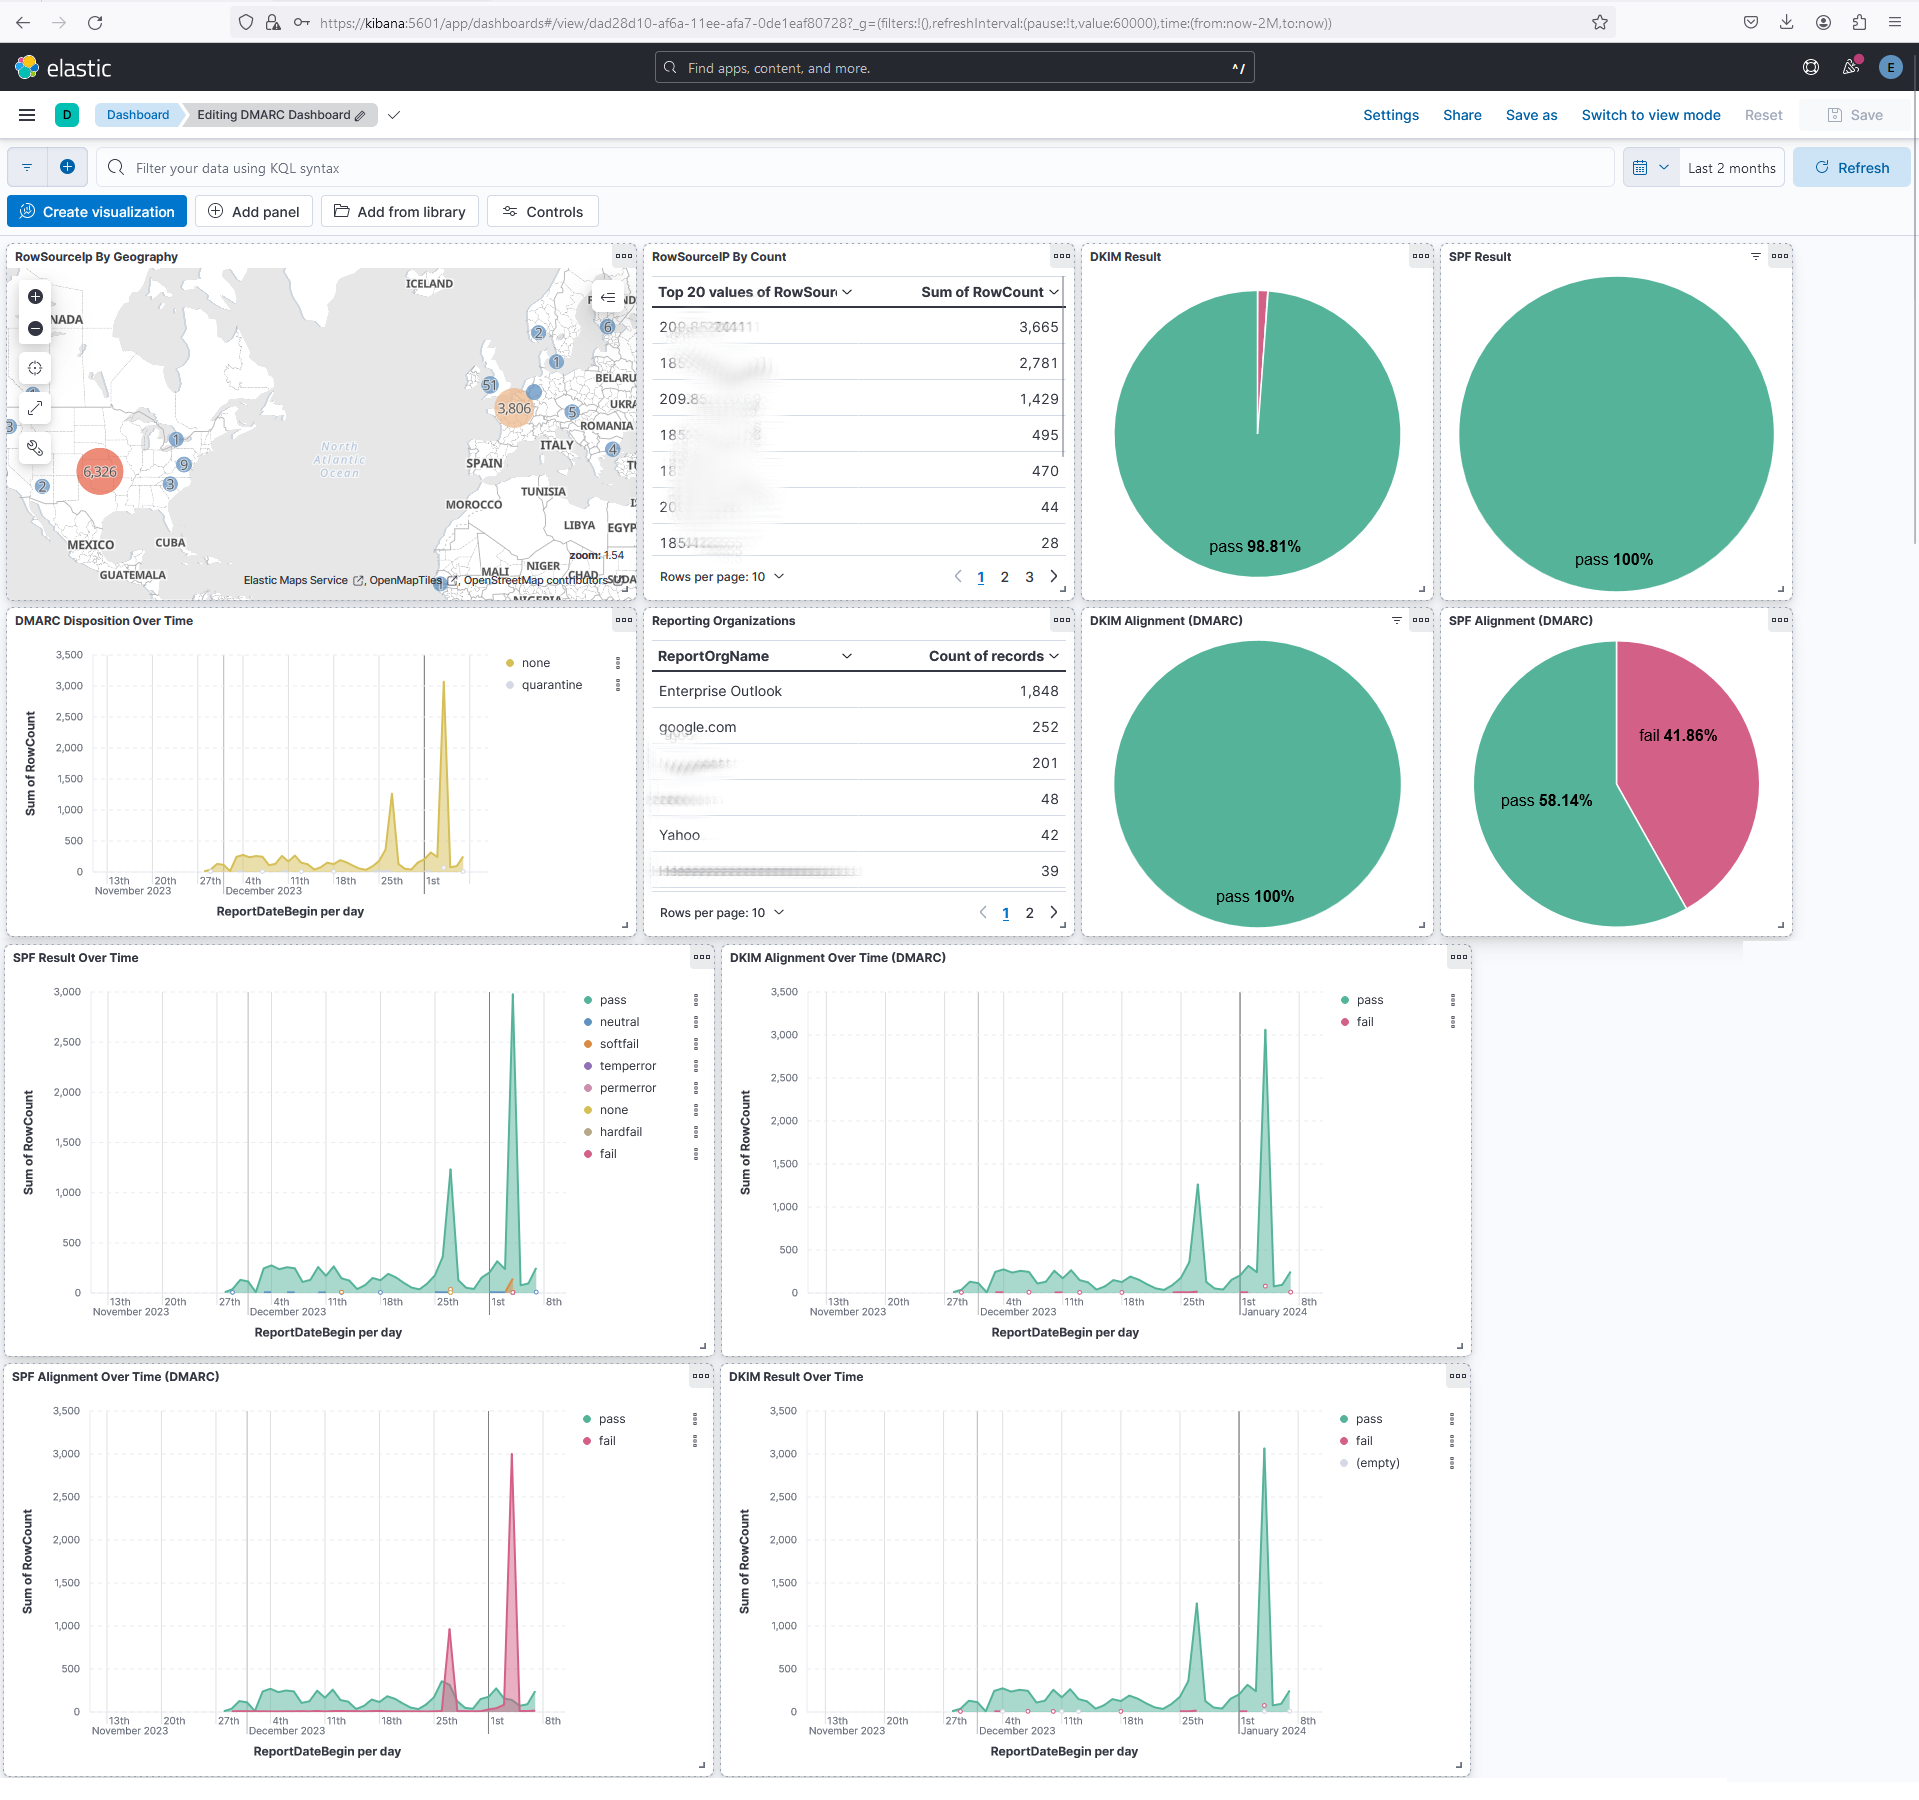
This is an open source data visualizer to help you analyze your DMARC Aggregate Reports. Watch the 5 minute video to see how you can install and start using this tool. If you wish to reverse engineer this tool for other applications, you can watch this 1 hour lecture that explains the source code line by line.
Here is a screenshot of the tool:

Requirements
A Linux Machine with Docker and Docker Compose installed.
Installation
Assume the ~/ reflects your project directory, meaning the same directory as the file docker-compose.yml. So if your docker-compose.yml is in /home/stephanie/dmarc/docker-compose.yml, then all mentions of ~/ in the instructions below will mean /home/stephanie/dmarc/.
Start Elasticsearch, Logstash and Kibana
- Make a copy of
~/env.sampleto~/.env. Optional - customize settings for better security. - Type
cd ~/to return to project directory. - Type
docker-compose up --build -dto start up the ELK project. - Login with
elasticand the password found in the~/.envfile to ensure the entire ELK stack is up and running. - Open your web browser and go to
https://<ip address or hostname of kibana>:5601. - Accept any security warnings about untrusted SSL certificates.
Ingest Data
- Make a copy of
~/parser/env.sampleto~/parser/.env. Optional - customize settings for better security. - Put all your zipped DMARC aggregation reports into the
~/parser/logs/zipped/. Sample DMARC aggregration reports can be copied from~/parser/logs/zipped-sample/. The zipped DMARC reports should end with any of the following filename extensions:*.gzor*.zip. - Type
docker exec -it dmarc-parser-1 ./start.shto extract, transform and load DMARC aggregation data into your ELK stack. - Go to your web browser in Kibana and go to Dashboards to see your DMARC Dashboard.